17 Jul 2026
Mapping Jackpot Seeding Protocols Across Multi-Operator Networks and Their Ties to Session Duration Trends
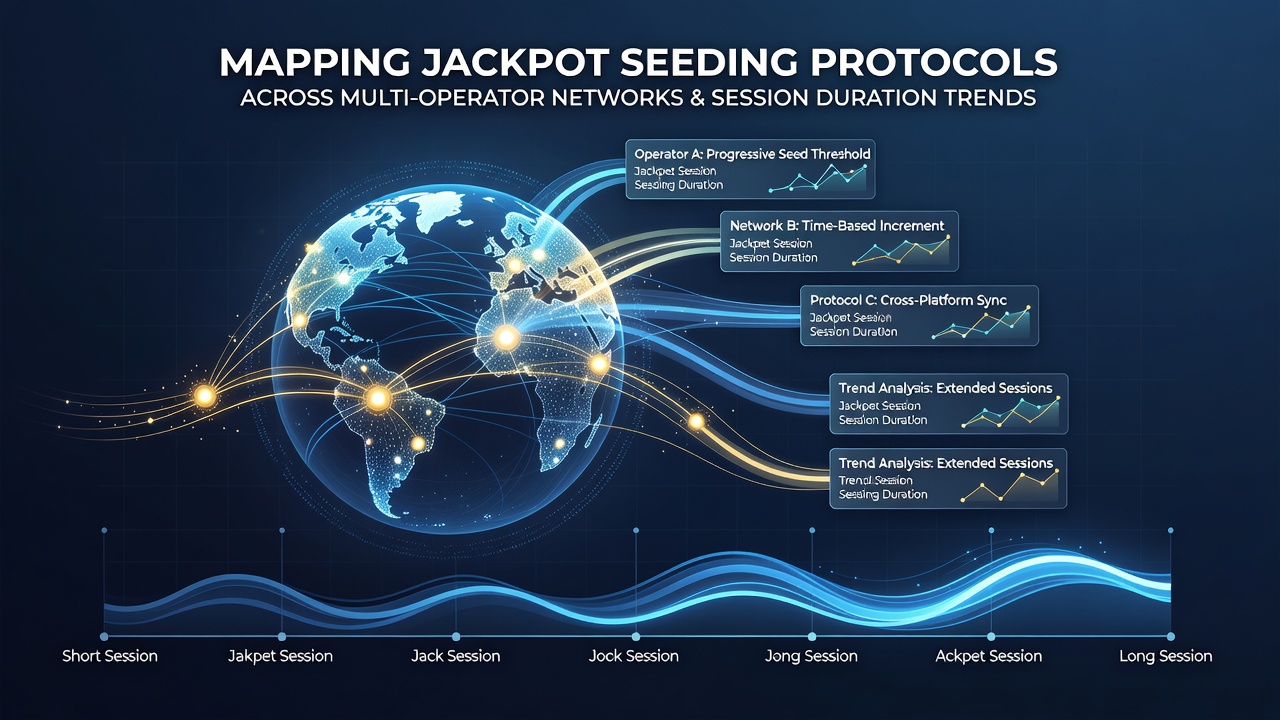
Jackpot seeding protocols determine how initial prize pools get funded across shared gaming systems, and operators track these mechanisms closely because they influence how long players stay engaged on connected platforms. Multi-operator networks pool contributions from multiple providers, which creates layered funding structures where each participant adds to a common progressive meter according to predefined rules, and these rules vary by jurisdiction and network agreement.
Core Elements of Seeding Protocols
Seeding begins with a base amount set by network administrators, after which player wagers contribute percentages that build the prize upward until a trigger event resets or reallocates funds. Protocols often specify minimum seed levels per operator, contribution rates ranging from 1 to 3 percent of qualifying bets, and reset mechanisms that replenish the pool immediately after a win, while some networks apply tiered seeds that scale with total network volume recorded in the prior period.
Data from aggregated systems shows operators adjust these parameters quarterly to balance payout frequency against reserve requirements, and such adjustments coincide with measurable shifts in average session lengths reported by platform analytics tools.
Network Structures and Cross-Operator Data Flows
Shared networks connect independent casinos through centralized servers that synchronize jackpot meters in real time, allowing a player at one site to compete for the same prize pool as users elsewhere. This setup requires standardized data exchange protocols for tracking contributions, verifying eligibility, and distributing winnings, with each operator maintaining local logs that feed into the central system for reconciliation.
Regional variations appear in how networks handle currency conversion, tax withholdings, and compliance reporting, yet the underlying seeding logic remains consistent within each consortium. Observers note that networks spanning multiple continents often implement segmented pools to account for differing regulatory thresholds, which fragments the data available for cross-network comparisons of session metrics.
Session Duration Patterns Linked to Seeding Variables
Analytics platforms record session lengths by measuring time between login and logout events or by tracking consecutive spins within a defined inactivity window. Studies conducted across shared jackpot environments indicate that higher initial seed values correlate with extended play periods, as players remain connected while monitoring meter growth toward perceived payout thresholds.
One analysis of aggregated logs from 2025 through mid-2026 found sessions averaging 22 minutes longer on networks that maintained seed levels above a certain benchmark compared with lower-seeded counterparts, though the relationship depends on additional factors such as game volatility and concurrent promotional activity. Figures reveal that contribution rate increases sometimes shorten sessions because players accelerate their betting pace to reach the next payout milestone faster.
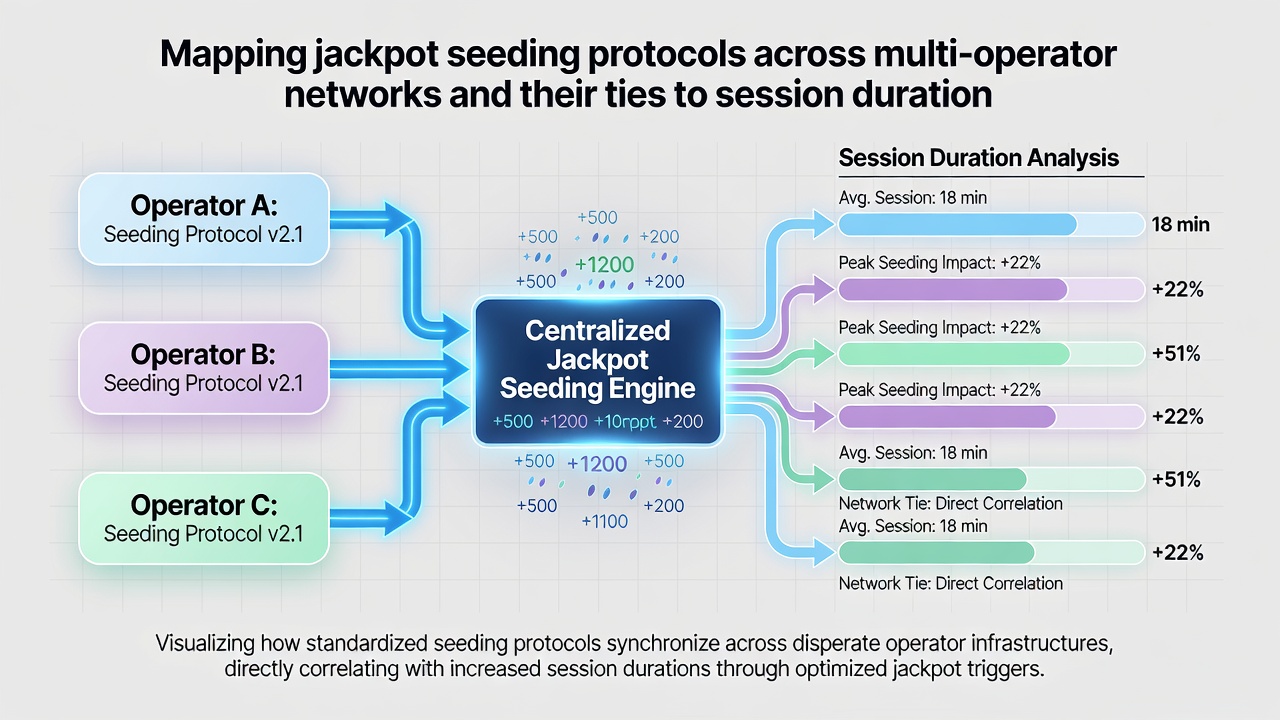
As of July 2026, several multi-operator consortia updated their seeding formulas to incorporate real-time volume weighting, which has produced preliminary data sets showing modest stabilization in session times across participating sites. Researchers continue to examine whether these protocol tweaks sustain longer engagement or merely redistribute activity among different game types.
Measurement Approaches and Data Sources
Operators rely on standardized event logging that captures timestamped wager data, meter increments, and player identifiers while preserving anonymity for compliance purposes. Third-party auditors verify the accuracy of these logs before they feed into broader trend analyses, and academic groups access anonymized extracts through research partnerships with network providers.
According to reports issued by the New Jersey Division of Gaming Enforcement, cross-network jackpot activity in the first half of 2026 displayed session duration variances of up to 18 percent between high-seed and low-seed configurations, though the agency notes additional variables such as device type and time-of-day patterns require further isolation. A separate examination by the UNLV International Gaming Institute mapped contribution flows across three major North American networks and identified consistent links between seed reset frequency and average play intervals.
Practical Implications for Network Operators
Operators adjust seeding parameters after reviewing aggregated session statistics, and they test modifications on limited cohorts before full rollout. These tests track metrics including total handle, repeat login rates, and meter visibility engagement, all of which feed back into protocol refinements. Networks that publish periodic transparency reports allow participants to benchmark their own data against consortium averages, revealing where seeding changes produce measurable shifts in retention curves.
Geographic segmentation within networks adds another layer, because players in different regulatory zones encounter distinct tax treatments and prize caps that indirectly affect how long they remain active during a given session.
Conclusion
Mapping jackpot seeding protocols requires systematic collection of contribution rates, reset rules, and meter synchronization methods across multi-operator environments, and available evidence connects these elements to observable differences in session duration. Continued monitoring through regulatory filings and academic partnerships supplies the datasets needed to refine these relationships over time, while July 2026 updates illustrate ongoing adaptation within the sector.